[Written September 2018]
Since the discovery of human-induced climate change the attempts made to limit our impact on earth’s systems have been minimal and ineffective. But why? As I transition from the physical sciences to the subject of sustainability I think a good place to start answering this question is to take a wide overview of the field. So here I include a timeline of major events in the story, mainly as a reference, and then to describe some of the most important findings and projections thus far.
Important events leading up to the Paris Agreement:
1972: UN Conference on The Human Environment
1984: Montreal Protocol (Amended by the Kigali Accord in 2016)
1987: Our Common Future (The Brundtland Report)
1990: Intergovernmental Panel on Climate Change (IPCC) first report
1992: Earth Summit (Repeated in 2002)
1995: First United Nations Climate Change Conference (Repeated yearly and currently active)
1997: Lisbon Principles
1997: Kyoto Protocol
2000: Millennium Development Goals
2000: UN Millennium Declaration
2000: Earth Charter
2008: Climate Change Act (UK)
2009: Copenhagen Accord
2015: Earth Statement
2015: Sustainable Development Goals
2016: Paris Agreement
Alongside these negotiations we have collected detailed scientific data and developed models to inform policymaking and set targets. One of the most recent and comprehensive models used to characterise the dynamic between human activity and the planet is known as the Earth3 model (Rockstrom,2018). This breaks down the system into nine planetary boundaries as shown in figure 1, which if crossed can cause the whole system to fail. Here, we group together those boundaries which share similarities or are closely related and interdependent.
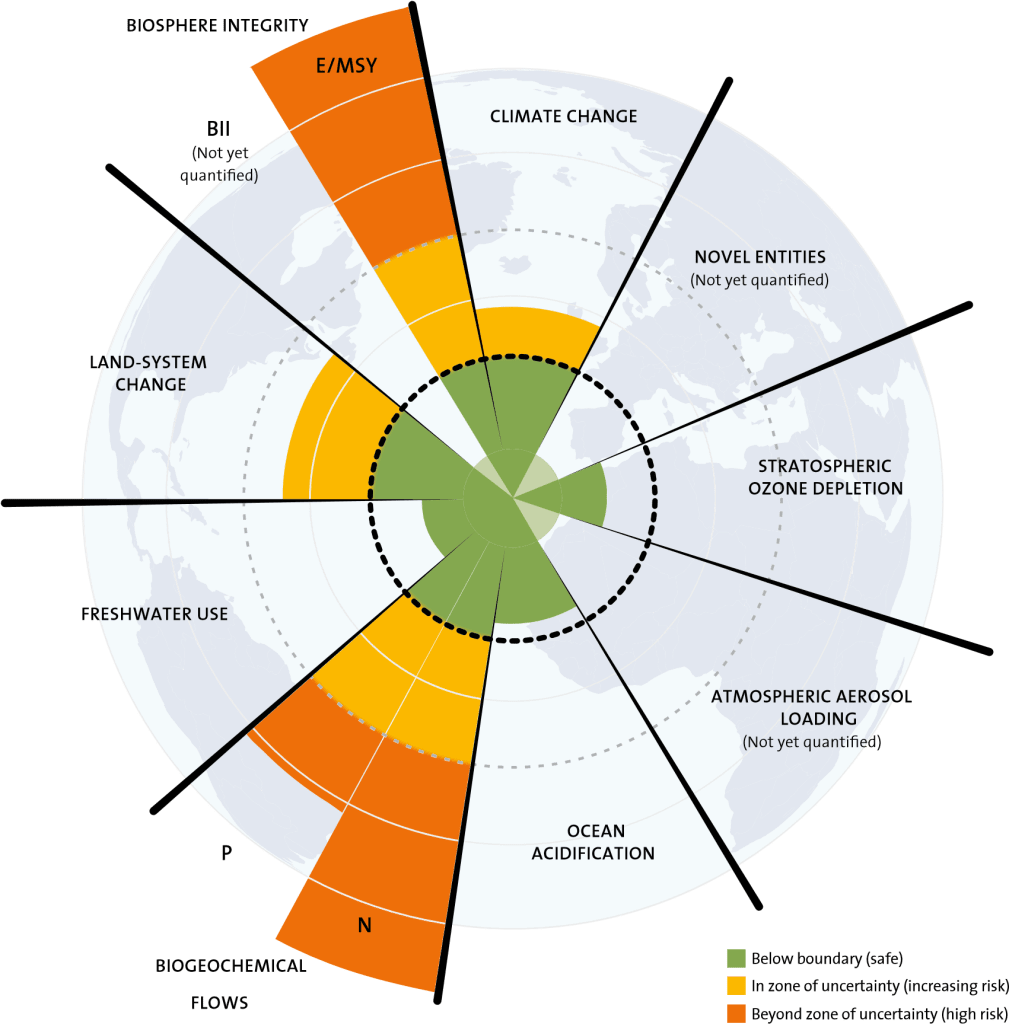
Figure 1: Nine planetary boundaries from Rockström et al. (2018). The dotted area represents the safe operating space.
The Nine Planetary Boundaries:
Atmospheric Aerosols and Chemical Pollution
Aerosols can create smog and contribute to the greenhouse effect by creating more cloud cover. Toxins such as persistent organic pollutants (POP’s) and heavy metals like mercury and lead can contaminate water and poison animals which get passed up the food chain to humans and threatens our genetic integrity. The Stockholm Convention of 2001 was drawn up to help address these issues.
Ozone Depletion
Certain chemicals break down stratospheric ozone molecules and many are involved in the process of refrigeration. Fluorocarbon refrigerants are also potent greenhouse gases and refrigerant management has been determined in one study to be the number one strategy to reduce global warming (Hawken,2017). The Montreal Protocol and Kigali Accord are agreements which have had success in reducing refrigerant risks to the atmosphere.
Biodiversity loss, Biogeochemical Flows and Ocean Acidification
Phytoplankton are at the bottom of the marine food chain and are responsible for half of the world’s oxygen (Harris,1986). Nutrient runoff from agriculture causes ocean dead zones and reduces phytoplankton populations (McQuaid et al.,2018) which both result in marine life loss. Rising atmospheric carbon dioxide (CO2) increases the seawater concentration of CO2. This lowers carbonate levels due to ocean acidification which consequently reduces phytoplankton populations (Sekerci and Petrovski,2018). These factors reduce the future ability of the ocean to absorb and capture CO2 and thus exacerbates the greenhouse effect.
Land Use and Freshwater Use
The intensive land use by animal agriculture is responsible for 91% of global deforestation (Margulis,2004) which increases biodiversity loss and further reduces CO2 absorption. Livestock production also contributes around 20% of all greenhouse gas emissions which is more than all transport combined, including aviation (Steinfield,2006).
Approximately 40% of ice-free land is used for agriculture (World Bank,2015), three-quarters of which is used for animal agriculture. 26% is devoted to pasture land and 14% is used for crops, one-third of which is used for animal feed. Agriculture, particularly meat and dairy, accounts for 70% of freshwater consumption (FAO,2016). The United Nations Food and Agriculture Organization (FAO) predicts that food production would have to increase globally by 70% by 2050 to feed the growing population of the time estimated to reach nearly 10 billion (FAO,2009).
So from these figures a rough calculation suggests agriculture will use up to 70% of earth’s ice-free land and require 50% more water in 2050. Realistically there is not enough land or water to sustain that amount and type of agriculture safely within the planetary boundaries. The most comprehensive study yet of global food consumption states that as an example of the changes needed the US and UK would need to cut beef consumption 90% and milk by 60% (Springman et al.,2018).
These two planetary boundaries also determine food security which in one recent study (Gro Intelligence,2017) projects a 214 trillion calorie food deficit by 2027 which equates to the population being short of 379 billion big macs each year. From these staggering figures a rethink on global food production appears necessary as well as strategies to limit population growth. It has been calculated that the number one personal action each citizen can make to help minimise climate change is to have fewer children (Wykes and Nicholas,2017).
Climate Change
Despite all of humanities negotiations, agreements and efforts in green energies; atmospheric greenhouse gases are still increasing (Peters et al.,2017). An alarming special report from the IPCC has warned that if drastic action is not taken we may be facing global catastrophe as early as 2030 (IPCC,2018). Another study goes further to predict that a point of no return may be reached by 2035 (Aengenheyster et al.,2018). Such a tipping point occurs when irreversible changes create a runaway greenhouse effect or cause positive feedback mechanisms in earth’s natural cycles. Some examples are shown in figure 2. This discourse has been prominent in the media since around 2005 (Hel et al,2018).
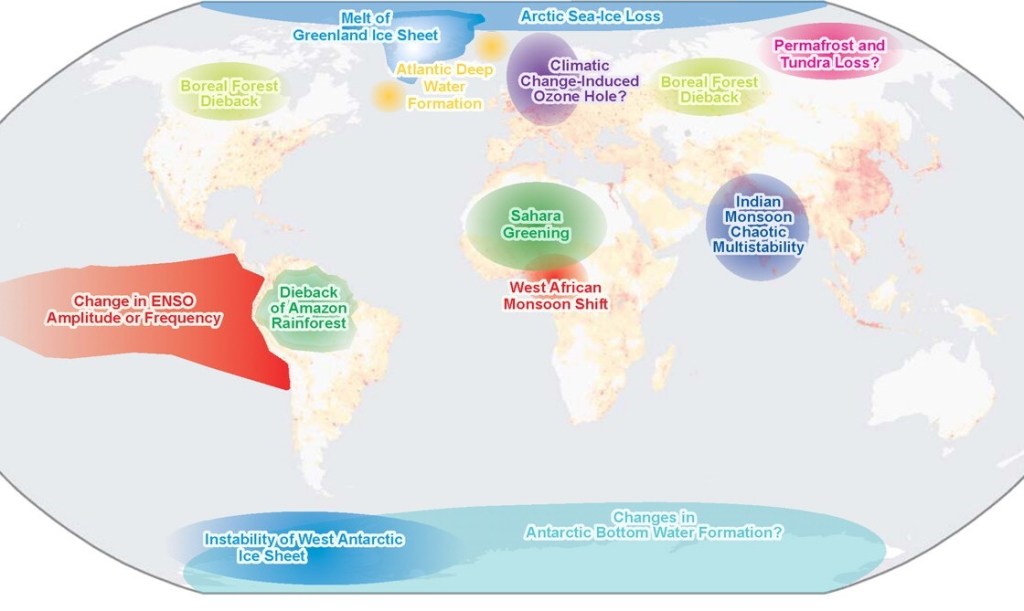
Figure 2: A map of earth showing some examples of global tipping points from (Lenton et al.,2008)
The dangers we face are beginning to permeate the public consciousness and be taken more seriously due to the extreme heatwaves and hurricanes of 2018 (Mcarthy,2018). Collectively these events and reports may put an end to climate change denial (Temple,2018) which, as a contradictory discourse, I think it has confused the issue and hampered progress. The choices humanity makes in the coming decade will prove critical to keep our planet habitable for the long term. Can we achieve this? Well… we will soon find out.
(1012 words)
References
McQuaid, J.B. Kustka, A.B. Obornik, M. Horak, A, McCrow, J.P. Karas, B.J. Zheng, H. Kindeberg, T. Andersson, A.J. Barbeau, K.A. Allen, A.E. (2018) Carbonate-sensitive phytotransferrin controls high affinity iron uptake in diatoms, Nature, 555, 534-537
Sekerci, Y. Petrovskii, S. (2018) Global warming can lead to depletion of oxygen by disrupting phytoplankton photosynthesis. A mathematical modelling approach, Geosciences 8(6) p.201
Harris, G.P. (1986) Phytoplankton ecology: structure, function and fluctuation, Berlin, Germany, Springer
Rockström, J. et al. (2018) Transformation is feasible, The club of Rome
IPCC SRI (2018), Global warming of 1.5°C, IPCC
Aengenheyster, M. et al. (2018) The point of no return for climate action: effects of climate uncertainty and risk tolerance, Earth system dynamics, 9(3), p.1085
Van der Hel, S. Hellster, J.
Steen, G. (2018) Tipping points and
climate change: metaphor between science and the media, Environmental
communication 12(5), 605-620
Peters, G.P. et al. (2017) Towards real time verification of CO2 emissions, Nature climate change, 7, 848-852
McCarthy, M. (2018) Was this the heatwave that finally ended climate denial? The Guardian 1st August, available at www.
Temple, J. (2018) The year climate change began to spin out of control, Technology review available from www.
Hawken, P. (2017) Drawdown the most comprehensive plan ever proposed to roll back global warming, USA, Penguin books
World Bank (2015) www.dataworldbank.org available from www.https://data.worldbank.org/indicator/AG.LND.AGRI.ZS?view=chart [accessed 4/11/2018]
FAO (2016) www.fao.org Aquastat, available from www.http://www.fao.org/nr/water/aquastat/tables/WorldData-Withdrawal_eng.pdf
[accessed 4/11/2018]
FAO (2009) 2050: A third more mouths to feed, available from www.http://www.fao.org/news/story/en/item/35571/icode/
[accessed 4/11/2018]
Steinfield, H. (2006) Livestock’s long shadow: environmental issues and options, Rome, Food and agriculture organisation of the United Nations
Margulis, S. (2004) Causes of deforestation of the Brazilian Amazon (World bank working paper Number 22) USA The World Bank
Gro Intelligence (2017) Gro-intelligence How can we avoid a food crisis that’s less than a decade away available from www.https://gro-intelligence.com/insights/214-trillion-calories
Lenton, T.M. Held, H. Krieglar, E. Hall, J.W, Lucht, W. Rahmstorf, S. Schellnhuber, H.J. (2008) Tipping elements in earth’s climate system, Proceedings of the national academy of sciences of the United States of America, 105(6) pp.1786-1793
Springman, M. et al. (2018) Options for keeping the food system within environmental limits Nature 10 October 2018
Wynes, S, Nicholas, K. A. (2017) The climate mitigation gap: education and government recommendations miss the most effective individual actions, Environmental Research Letters, 12(7)
